People in Hong Kong Have the Longest Life Expectancy in the World: Some Possible Explanations

Since 1985, Japan has led the world in life expectancy, but Hong Kong, the once British colony and now a special administrative region of China, has taken over the lead position since 2010. With its extremely rapid post–World War II (WWII) economic development and its associated epidemiological transition from communicable to noncommunicable diseases as the leading causes of death, Hong Kong’s life expectancy has seen a steady increase over the past half-century with 81.9 years for men and 87.6 years for women in 2017 [1]. The question is why this number has risen so steadily, and whether there is anything that can be learned from the Hong Kong experience for the world at large.
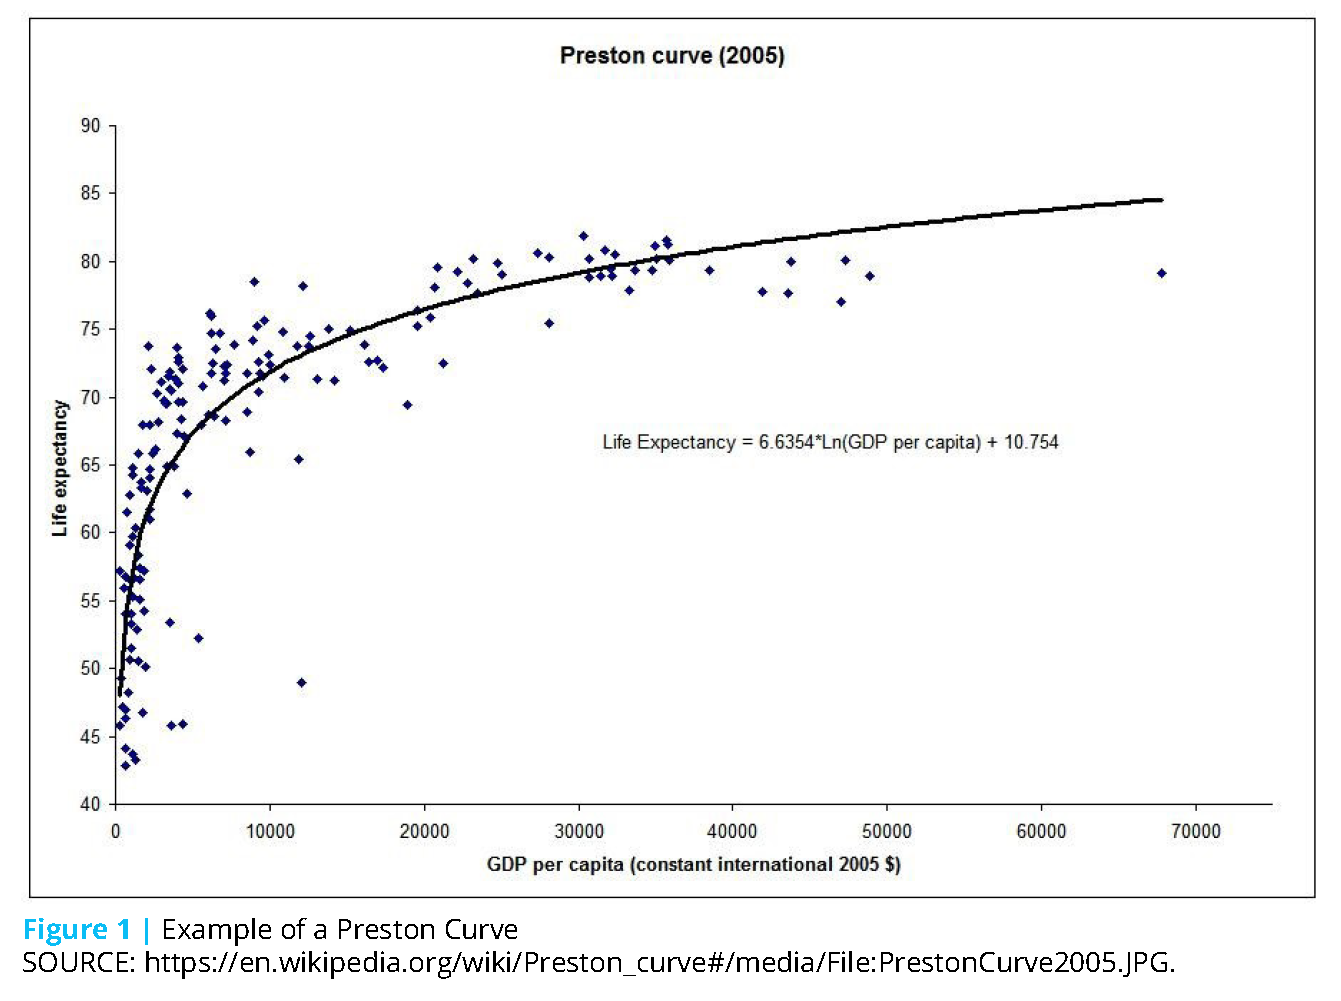
The Preston Curve, comparing countries, plots a country’s life expectancy against its national income, measured as gross domestic product (GDP) per capita. The shape has been described as an upside-down hockey stick: a steep relationship between national income and life expectancy at lower levels of income; a flattening of the relationship as countries become richer [2]. In other words, there are diminishing returns to life expectancy gain as the countries become richer (see Figure 1). Hong Kong, with high GDP per capita, is on the flat part of the curve. The fact that it is not necessarily national income that accounts for Hong Kong’s long life expectancy can be illustrated by comparison with the United States. The GDP for the United States per capita is higher than Hong Kong, but its life expectancy is more than 6 years lower (see Table 1). Clearly, factors other than the general population-level wealth are at play.
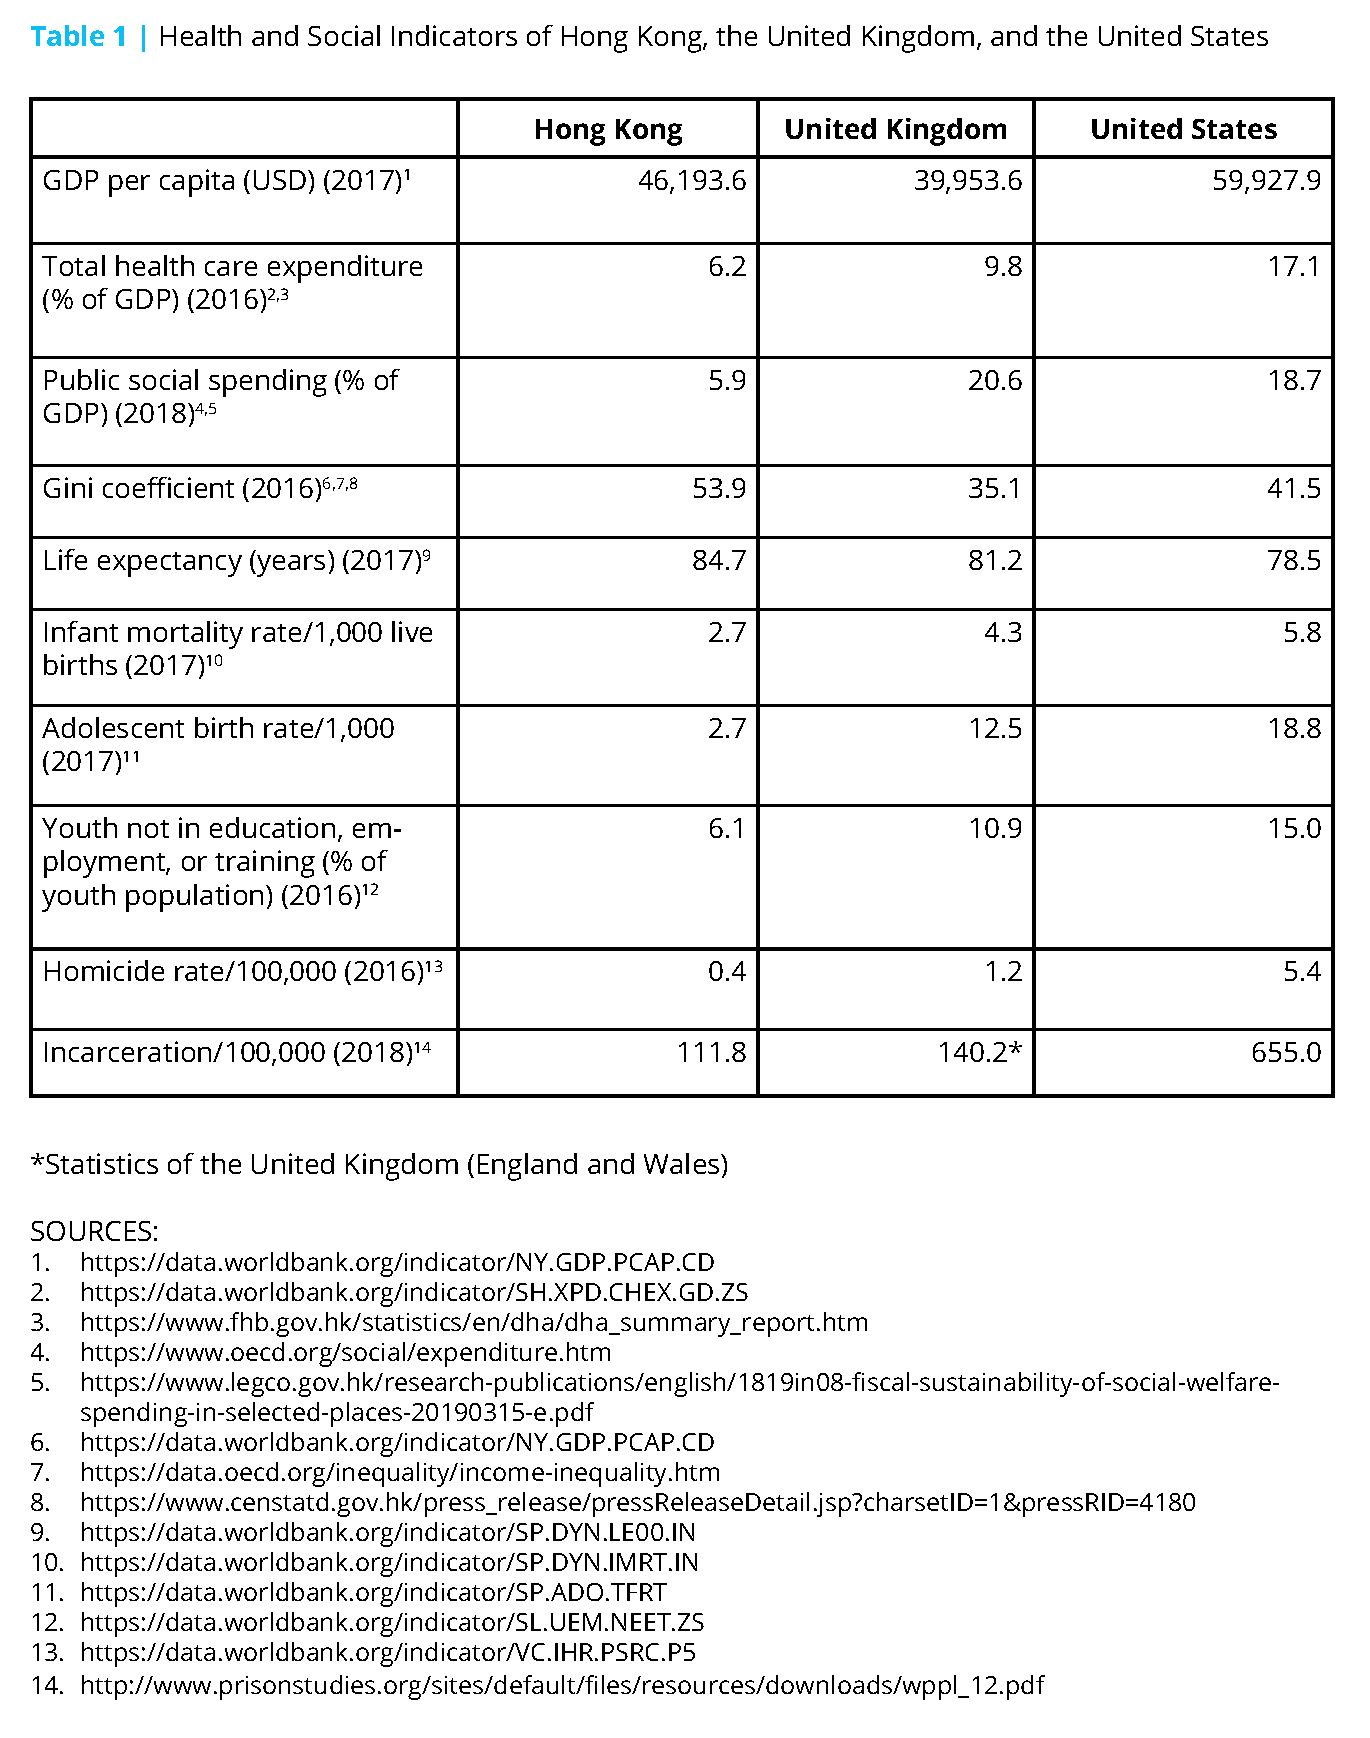
In Table 1, the authors of this commentary compare Hong Kong’s health and social indicators with those of the United Kingdom and the United States, two longterm developed Western countries with high GDP per capita (the flat part of the Preston curve). Hong Kong consistently edges out the United States and the United Kingdom in terms of social indicators—adolescent birth rate, youth involvement in education or employment, homicide rate and incarceration rate—and health indicators—life expectancy and infant mortality rate. This favorable picture is despite Hong Kong’s spending less on both health and social care as a proportion of GDP. In particular, Hong Kong’s infant mortality rate is among the lowest in the world, which is a strong indicator of good quality maternal and child health care, and of positive social conditions for parents. Hong Kong’s superior performance in social indicators, when taken together, is also suggestive of better job security, better reproductive and maternal health care, and generally less hostile social environments with less violent crimes (despite the recent uprising against an extradition bill to China). The Hong Kong story has defied the conventional wisdom that the more money spent on health and social care, the better the health performance. Furthermore, studies in Organization for Economic Co-operation and Development (OECD) countries have shown that income inequality as measured by the Gini Index is generally associated with lower life expectancy, possibly through the macro-environmental effect of income inequality on population health [3]. The Gini Index is an indicator of the income distribution across income percentiles in a population. Hong Kong also challenges this relationship by having one of the highest Gini coefficients among the developed world; one that is even greater than that in the United Kingdom and the United States. Something in the Hong Kong context appears to be protective of potentially damaging effects of wide income inequality.
Other factors that have been hypothesized to contribute to this relative health advantage in Hong Kong include the non-Western diet; the physical and built environment where public transportation, sports centers, grocery stores, shops that sell commodities of basic living, and private health care clinics are readily available; the geographical location with subtropical climate that does not give rise to frequent extreme weather; and the existence of a public health care system that gives people adequate health care, regardless of lack of means.
Though plausible, the authors of this commentary are cautious in accepting these as explanations for Hong Kong’s longevity. In fact, Hong Kong’s per capita meat consumption is the highest in the world [11], and people in Hong Kong are not particularly active in general [12]. Hong Kong does not have extreme climate, but other parts of the world renowned for their relatively healthy older populations may have extreme weather (e.g. Switzerland, Italy, Sweden), and yet other places without extreme weather may not achieve great longevity (e.g. Indonesia, Samoa, Philippines) [1]. Moreover, despite the existence of a public sector in Hong Kong’s health care system, it focuses mainly on inpatient care, with up to 70% of the outpatient services privatized, which may lead to inaccessibility of care due to unaffordability through the wider social determinants of health. Also, Hong Kong does not have an organized primary care system, which has been consistently proven to be conducive to better health and health care. Primary care services in Hong Kong are provided not only by general practitioners or family medicine specialists but also physicians of other specialties, and because they are mostly provided by the private sector of which the fees tend to be at least five times more expensive than the public sector, it may lead to inequality in terms of access to primary care. It has been reported that up to 8.4% of Hong Kong’s general population did not seek health care due to lack of financial means using data collected in 2014–2015 [4].
If Hong Kong’s health success cannot simply be attributed to its health care system, two other potential explanations are worth considering.
First, cohort effect across generations is a possible explanation. Life expectancy has often been (mis)understood as a projected indicator of how long on average people in a specific population may live. But, in fact, life expectancy is calculated using current age-specific mortality rates of the particular year of interest. In other words, it is a cross-sectional indicator of the current health situation of the population. Because mortality rates increase with age, the estimation of life expectancy is heavily affected by the mortality rates among the older people in the population in the current year of interest—especially in populations in which infant mortality rates are low. In Hong Kong, the majority of the older people were migrants from mainland China who likely survived war, famine, and hardships and migrated to Hong Kong during the post-WWII and Civil War period in the 1950s and 1960s. Thus, they might tend to be healthy and resilient. On the contrary, the cohorts born after the 1940s represent people born into a relatively developed environment of Hong Kong as compared with that of China, and the subsequent generations were increasingly born to a more developed environment. One possible implication is that the subsequent generations may not be as resilient as their migrant predecessors.
However, this speculation of a cohort effect is not supported by the latest adult mortality rates (the probability that a 15-year-old will die by age 60) among the three jurisdictions [5]. Hong Kong’s adult mortality rates for both sexes are among the lowest in the world (67/1,000 for men and 36/1,000 for women), the United Kingdom is worse (84/1,000 for men and 54/1,000 for women), and the United States is the worst among the three (134/1,000 for men and 80/1,000 for women). In other words, Hong Kong adults below age 60 are also generally healthy, and there is probably no strong cohort effect that will upset the life expectancy of these future older generations.
Second, studies have shown clearly that health inequality exists in Hong Kong, in terms of health outcomes, health behavior, and health care services [6]. Unlike in the United States, where race is a powerful predictor of health owing to social disadvantage and intersectionality, Hong Kong is a largely homogeneous population with more than 90% ethnic Chinese. Thus, racial disparities are not as prevalent as in the United States. Even if race is out of the picture, health inequality still persists. In fact, much of the health inequality in Hong Kong can be explained by socioeconomic position (SEP), in which income poverty, deprivation (defined as a state of observable and demonstrable disadvantage relative to the local community or the wider society or nation to which an individual, family, or group belongs) [10], and low SEP are found to be linked to poorer health [6,7]. Another study also found that lower neighborhood-level SEP predicted higher age-standardized mortality rates over the past few decades [8]. Furthermore, even within the same race, migrant status (local born versus non-local born Chinese) can also make a difference, and there is a considerable level of intersectionality of being non-local born with low SEP. Many non-local born Chinese are women who migrated to Hong Kong (usually) to reunite with their male counterpart, who also tend to have low SEP [9]. There are also other disadvantaged and marginalized groups that may face health inequity—including but not limited to ethnic minority, foreign domestic workers (usually from the Philippines and Indonesia), people with long-term serious illness, and others—that warrant further investigation.
In summary, while the success of Hong Kong’s economic development must be considered an important factor in its success in achieving long life expectancy, this requires both context and a nuanced understanding of the influences affecting health. In particular, it seems most likely that those related to social conditions and environments are acting collectively in a way that propels Hong Kong to surpass other well-developed countries. Yet, we should be vigilant as to whether the different forms of social inequality that currently exist in Hong Kong are storing up problems for the future and will affect the life expectancy of future generations of older people. Meanwhile, there could not be a more important puzzle to solve for the rest of the world—how did a former British colony of largely ethnic Chinese people with a semi-autonomous political status situated at the edge of southeast China achieve such a great life expectancy, despite spending so little on health and social care and having among the worst income inequality in the world? More work is needed, and comparisons ought to be drawn between Hong Kong and other developed Asian countries to identify meaningful differences and commonalities that are related to health and longevity.
Join the conversation!
![]() Tweet this! The authors of our newest #NAMPerspectives commentary compare the life expectancy of those who live in Hong Kong against those who live in the UK and the US and identify potential indicators that could impact public health interventions worldwide: https://doi.org/10.31478/202001d
Tweet this! The authors of our newest #NAMPerspectives commentary compare the life expectancy of those who live in Hong Kong against those who live in the UK and the US and identify potential indicators that could impact public health interventions worldwide: https://doi.org/10.31478/202001d
![]() Tweet this! Hong Kong’s infant mortality rate is among the lowest in the world, despite the fact that Hong Kong spends less on both health and social care compared to the UK and the US. See what lessons could be learned from these data: https://doi.org/10.31478/202001d #NAMPerspectives
Tweet this! Hong Kong’s infant mortality rate is among the lowest in the world, despite the fact that Hong Kong spends less on both health and social care compared to the UK and the US. See what lessons could be learned from these data: https://doi.org/10.31478/202001d #NAMPerspectives
![]() Tweet this! Examining the life expectancy and contributing factors of those who live in Hong Kong could inform approaches to healthy longevity worldwide. Read a new #NAMPerspectives that breaks down these many factors: https://doi.org/10.31478/202001d
Tweet this! Examining the life expectancy and contributing factors of those who live in Hong Kong could inform approaches to healthy longevity worldwide. Read a new #NAMPerspectives that breaks down these many factors: https://doi.org/10.31478/202001d
Download the graphics below and share them on social media!
References
- The World Bank. 2017. World Bank Open Data. Available at: https://data.worldbank.org (accessed June 20, 2019).
- Preston, S. H. 2007. The changing relation between mortality and level of economic development. International Journal of Epidemiology 36(3):484–490. https://doi.org/10.1093/ije/dym075
- Pickett, K. E., and R. G. Wilkinson. 2015. Income inequality and health: A casual review. Social Science & Medicine 128:316–326. https://doi.org/10.1016/j.socscimed.2014.12.031
- Wong, S. Y., R. Y. Chung, D. Chan, G. K. Chung, J. Li, D. Mak, M. Lau, V. Tang, D. Gordon, and H. Wong. 2018. What are the financial barriers to medical care among the poor, the sick and the disabled in the Special Administrative Region of China? PLoS ONE 13(11):e0205794. https://doi.org/10.1371/journal.pone.0205794
- United Nations Development Programme. 2019. Human Development Reports. Human Development Data (1990–2017). Available at: http://www.hdr.undp.org/en/data (accessed June 21, 2019).
- Chung, R. Y., and S. Y. S. Wong. 2015. Health inequality in Hong Kong. China Review: An Interdisciplinary Journal on Greater China 15(2):91–118. Available at: https://www.researchgate.net/publication/287727664_Health_Inequality_in_Hong_Kong (accessed September 2, 2020).
- Chung, R. Y., D. Gordon, S. Y. S. Wong, D. Chan, K. K. Chung, M. Lau, V. Tang, and H. Wong. 2018. Deprivation is associated with worse physical and mental health beyond income poverty: A population-based household survey among Chinese adults. Quality of Life Research 27(8):2127–2135. https://doi.org/10.1007/s11136-018-1863-y
- Chung, R. Y., F. T. T. Lai, G. K. K. Chung, B. H. K. Yip, S. Y. S. Wong, and E. K. Yeoh. 2018. Socioeconomic disparity in mortality risks widened across generations during rapid economic development in Hong Kong: an age-period-cohort analysis from 1976 to 2010. Annals of Epidemiology 28(11):743–752. https://doi.org/10.1016/j.annepidem.2018.06.004
- Census and Statistics Department, The Government of the Hong Kong Special Administrative Region. 2018. Hong Kong Annual Digest of Statistics. Available at: https://www.censtatd.gov.hk/hkstat/sub/sp90.jsp?productCode=B1010003 (accessed January 8, 2020).
- Townsend, P. 1987. Deprivation. Journal of Social Policy 16(2):125–146. https://doi.org/10.1017/S00472794000020341
- Yau, Y. Y., B. Thibodeau, and C. Not. 2018. Impact of cutting meat intake on hidden greenhouse gas emissions in an import-reliant city. Environmental Research Letters 13(6). https://doi.org/10.1088/1748-9326/aabd45
- Surveillance and Epidemiology Branch Centre for Health Protection, Department of Health. 2017. Behavioural Risk Factor Survey (April 2016). Available at: https://www.chp.gov.hk/files/pdf/brfa_report_april_2016_eng.pdf (accessed January 8, 2020.)