Exploring the Potential of Tax Credits for Funding Population Health

Introduction
Over the past several years, hundreds of regional multisector partnerships have formed across the country to improve population health. These partnerships recognize that the health and well-being of the residents in their regions are produced by a variety of conditions and determinants—including housing, education, the environment, and the economy—and that clinical health care is but one of these. The partnerships also recognize that if they fail to widen their focus toward improving population health, chronic conditions and health care costs will continue to rise, and deep health inequities will remain [1,2]. While successful strategies are emerging, professionals working on population health remain challenged by the lack of sustainable financing for effective interventions. Most multisector partnerships operate on shoestring budgets and overwhelmingly rely on grants for their funding [3]. Changing these conditions to an environment of more reliable funding would make a critical difference in enabling the partnerships’ progress.
There are many more substantial and sustainable funding sources to which multisector partnerships might turn, including direct government funding, but these sources are not easy to access. Nonetheless, the stakes are high in the work of improving population health, and those involved must examine ways to secure sustainable funding. This discussion paper explores one such possibility: tax credits. Tax credits are a type of tax expenditure or tax break. Through tax credits, taxpayers share the cost of purchasing or producing a good or service with those in private markets, with the intent of stimulating the markets for that good or service.
This paper reports the outcomes of research exploring the potential of tax credits as both a sustainable financing source for population health and a sound investment for taxpayers. First, it establishes that tax expenditures are commonly used in policy, totaling trillions of dollars annually in the United States. Next, it suggests certain population health interventions that are suitable candidates for a tax credit. Design is critical to the effectiveness of any tax credit, so this paper reviews the design elements of various types of tax credits to see how they might be applied to a population health tax credit. Based upon this exploration, the paper concludes by providing two potential prototypes for state population health tax credits, to illustrate how states might begin to put this idea into practice.
This paper does not provide a comparative analysis of various financing options. It does not discuss the entire tax policy landscape or compare and contrast the merits and drawbacks of direct government spending versus tax credits.
A Brief Overview of Tax Expenditure Policy
Tax policy is two-sided, much like an old-fashioned vinyl record. Side A concerns the imposition of taxes—who should pay and how much—and plays out amid hot public debate and attention. Side B concerns tax expenditures, commonly known as tax breaks, and typically receives much less attention. It might come as a surprise that the growth of federal tax expenditures has exceeded that of federal discretionary spending over the last 40 years [4]. Tax expenditures were claimed on 169 million federal tax returns in 2016, netting out at around $1.5 trillion, roughly the same amount as total discretionary spending in the federal budget (see Figure 1).
The simplest way to think of tax expenditures is as a set of gigantic rebate programs. Some of the rebate programs are straightforward and simple, while others require a great deal of paperwork, accounting, and legal counsel. Some programs offer rebates to corporations, some to individuals, and some to both. The “expenditure” of tax breaks comes in the form of reduced revenue to the US Treasury (or other taxing entity).
The federal tax code has allowances for approximately 170 tax expenditures across sectors as diverse as national defense, agriculture, housing, energy, natural resources, international affairs, health care, transportation, community development, education, income security, and more. State tax structures often mirror the federal structure, allowing the same deductions, exclusions, and credits. In addition, states and localities operate their own tax programs, especially relating to business incentives, such as enterprise zones (where tax expenditures are offered to encourage business investment and job creation in impoverished areas) and film production credits. State and local business incentives available in 2015 totaled an estimated $45 billion [5].
Unlike government appropriations—which pay directly for goods and services (one major type of appropriation is a government transfer: money sent to individuals, other units of government, or entities that then use the money to make purchases in the private market)—tax expenditures are intended to incentivize the supply or demand for goods and services in the private market. Through the “rebate,” tax expenditures reduce the cost of producing or consuming a good or service, thereby encouraging more supply or demand.
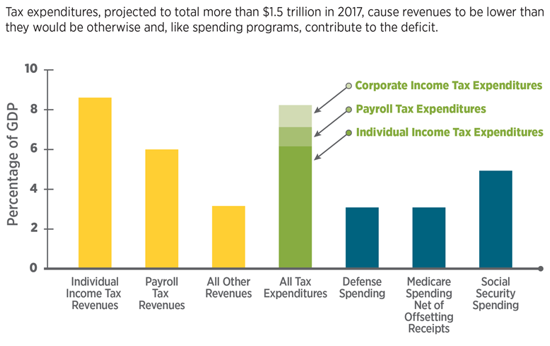
Figure 1 | Revenues, Tax Expenditures, and Selected Components of Spending, 2017
SOURCE: Shakin, J., “Tax expenditures, March 2017,” Congressional Budget Office. Available at: https://www.cbo.gov/publication/52493 (accessed July 25, 2018).
Two Premises for Making Effective Tax Expenditure Policy
There are numerous types of tax expenditures. The three most common types are tax deductions (e.g., certain expenses, such as charitable giving, reduce taxable income), exclusions (e.g., sources of income, such as social security income, are not counted in taxable income), and tax credits (e.g., a dollar-for-dollar reduction in tax liability, such as the child care tax credit). Of the three, tax credits typically provide a larger and more predictable financial incentive because they reduce a taxpayer’s liability on a dollar-for-dollar basis (a $100 credit reduces taxes by $100). Compare this, for example, to a $100 deduction, which reduces taxable income by $100. So to a taxpayer paying a 15 percent marginal tax rate, the deduction is worth only $15.
Despite the ubiquitous use of tax breaks, the authors of this paper discovered that very few are specifically aimed at improving population health. Why couldn’t there be more broadscale tax credits for interventions shown to improve population health? What would it take to create an effective population health tax credit?
This paper is based on two premises about how tax expenditure policy ought to be approached. First, tax expenditures represent an investment by taxpayers. Taxpayers should expect positive returns to public welfare; if not, why grant tax breaks? These tax breaks must be held to produce positive public returns. However, this premise is not held unilaterally.
The US Government Accountability Office reported in 2016 that federal agencies named only 11 tax expenditures as contributing to their mission or goals [6]. In its review of the $45 billion in state and local business incentives, the W. E. UpJohn Institute for Employment Research reported, “Incentives do not have a large correlation with a state’s current or past unemployment or income levels, or with future economic growth” [5].
Second, the effectiveness of a tax expenditure program is largely contingent on how it is structured. Many tax expenditure programs suffer from weak design, including inattention to the structure and strength of underlying markets, vague goals, imprecise criteria for claiming the tax break, and lack of accountability mechanisms.
Population Health: A Good Candidate for Tax Credits
A Portfolio of Interventions
What would a population health tax credit fund? Population health is not a good or service itself, but an outcome from an array of interventions designed to improve health. One might think of investments in population health as a portfolio of interventions designed to improve the health and well-being of the community at large, much like employer wellness programs pay for an array of services to improve employee health.
Population health is a good candidate for tax credits for two reasons. First, it is a “merit good,” and thus society at large stands to gain from additional investment in population health. Population health interventions have the following attributes of a merit good: 1) the benefits or returns accrue over time, so they are undervalued when making consumption decisions; 2) benefits or returns are captured by numerous entities in addition to the buyer; and 3) low-income individuals are not able to afford the full market price, which means they will underconsume. In short, merit goods are undervalued by the consumer, leading to too little supply.
Second, there are numerous evidence-based interventions that potentially offer taxpayers and private investors enough financial and/or social returns that certain markets may be activated to produce improved population health.
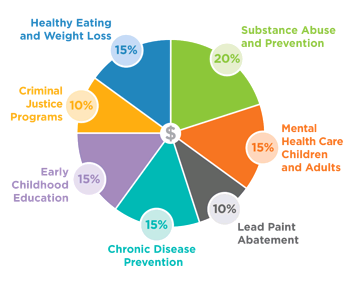
Figure 2 | Hypothetical Portfolio of High-Impact Population Health Investments
SOURCE: Reprinted with permission from ReThink Health
Currently, population health interventions, as a set of desirable goods and services, reside in a state of market failure: the private market is “incomplete,” producing too few of these goods and services. An incomplete market is one where not all of the necessary conditions for market formation exist. In the case of incomplete markets, total supply is insufficient to meet the needs of consumers.
Positive Return on Population Health Investment
A wide body of evidence attests to the fact that population health spending falls short of socially optimal levels. While it may not be possible to specify exactly where the optimal level lies, various studies have shown positive return on investment (ROI) when just $10 to $400 per capita is spent. For a frame of reference, the US health care system’s per capita spending on health care was $10,348 in 2016, with administrative costs alone estimated at around $800 per capita. Employer wellness programs average about $700 a year, per employee [7,8].
At the intervention level, numerous population health investments have been demonstrated to have positive ROI for taxpayers and society at large. For example, the Washington State Institute for Public Policy (WSIPP) conducted meta-analyses of hundreds of social and health interventions to estimate expected yields from any given intervention in order to identify the best candidates for investment. This robust, evidence-based database catalogs costs, benefits, recipients of benefits (e.g., taxpayers, individuals, or others), sector to which the benefits accrue (e.g., education, health, employment), and time frame over which the benefits materialize [9]. Interventions with proven effectiveness can be found in numerous sectors and include mental health treatment for adults and children, promotion of maternal health, substance abuse prevention and treatment, lead abatement, child welfare improvement, K-12 education, healthy eating and weight loss programs, and criminal justice programs.
Consider, for example, an opioid addiction treatment program that costs $350 per person (the example draws on WSIPP data) . In two years, it returns $2,700 in financial gains and the equivalent of $5,300 in social gains per person treated. This looks like a very attractive investment on its face because the benefits far outweigh the costs, and the returns are realized in a very short time. But a major reason these investments are not already being made is that the financial gains are split across many parties. Taxpayers save $350 in health care costs and health plans save an additional $350 in health care costs. Neither receives enough gain to be willing to bear the full program cost of $350—each would only break even after two years.
A population health tax credit would create a financial incentive for the potential investors. Suppose a tax credit rebated half the cost to the health plans; the cost of the program is split 50-50 between taxpayers and health plans. The net cost to each is $175, but they each receive $350 in financial gain. The incentive to invest is now greatly enhanced. Meanwhile, many other sectors would have also benefited for zero investment cost.
A state interested in the use of tax credits for population health has two options. The first is to create a new tax credit. The immediate effect of a new tax credit is to reduce revenues to the treasury, making it more difficult to balance the state budget (which is required of all states except Vermont) and/or reducing revenue available for direct appropriations [10]. A second option is to repurpose an existing tax credit and apply it to population health. The first case is similar to a stock market investor adding money to stock market holdings and choosing less discretionary income (at least for the time being). The second is like rebalancing a stock portfolio, thinning underperforming stocks and adding new, more promising opportunities. In the first case, the investor seeks positive returns above some threshold. In the second case, the investor seeks higher returns than the current portfolio is yielding. The second way offers states the opportunity to improve their investment returns over time, with no added costs to their budgets.
Methodology
The authors of this paper sought to explore how tax credits could stimulate sizable and sustainable financing for population health and, if so, under what conditions. Tax credits are numerous, and of many different types and intended objectives, so the application of tax credits to population health is not immediately clear. To make the exploration more manageable, we first sorted tax credits into classes according to the manner by which they operate to increase the supply of and demand for goods and services. Four classes emerged that are relevant to this paper’s analysis:
-
- Demand credits, such as solar energy tax credits, operate similarly to consumer rebates. They reduce the price of a good or service for consumers, thereby stimulating demand.
- Supply (or production) credits subsidize the cost of producing a good or service, such as in the case of cellulosic ethanol (biofuels from plant fibers) tax credits.
- Investable tax credits are a form of production credit in which claimants deduct a percentage of investment costs from their tax liability. Investable tax credits often create a marketable financial asset in the process, because these tax credits are transferrable. The most prominent example is the Low-Income Housing Tax Credit (LIHTC).
- Charitable tax credits are a lesser-known form of credit offered by some states to stimulate an increase in charitable giving. It is similar to the well-known deduction for charitable giving. However, the charitable tax credit is a more financially powerful tax credit form, because it offers the donor a credit back on a portion of the donation in an amount greater than the deduction. For example, a $100 donation made with a 30 percent tax credit enables the donor to deduct the full $100 from federal taxes while recovering $30 of the donation through the tax credit. Examples include the Iowa community foundation tax credits and the Arizona tax credit for anti-poverty programs.
A fifth type of credit has the primary purpose of providing income support. An example is the Earned Income Tax Credit (EITC), which is the largest single tax credit in terms of dollars [11]. This class of tax credit was not considered within this paper because it cannot be used as a direct financing source for population health interventions, although one could clearly make the case (based on growing evidence) that income support, and EITC specifically, helps improve population health [12,13].
To better understand how tax credits could become a source of financing for population health on a broader scale, the authors of this paper then examined the literature for each of the four classes of tax credits. In addition to focusing on evaluative research, we reviewed specific tax credits from each class to gain insights. Our research also uncovered some emerging examples of tax credits created to support population health. Table 1 briefly outlines the current examples, including the emerging population health examples, for each class. This paper goes on to discuss the findings related to the structure and design of each class of credit.

Important Considerations in Designing a Population Health Tax Credit
The authors’ review of literature suggested that numerous design features are important when creating a tax credit for population health. This section is hardly exhaustive, but it highlights some of the more salient questions for the policy maker’s consideration.
Some key questions to consider:
- Source of funds: Who is the taxpayer?
- Market conditions: Are there markets that can be stimulated to produce population health?
- Price sensitivity: What is the optimal size of the tax credit?
- Distributional impacts: Is there a gap between who claims the tax credit and who actually benefits from the proceeds?
- Accountability: How do taxpayers know that the tax credit is achieving its aims?
- Simplicity: What is required to administer the tax credit?
Source of Funds: Who is the Taxpayer?
Although it seems obvious, it is still worth stating: tax credits have value only for those who pay taxes. Many population health interventions are rooted in the public and nonprofit sectors, but neither public sector nor nonprofit providers pay income or property taxes. Thus, the first task is to identify entities that would benefit from reduced taxes and that have an interest in population health outcomes.
Market Conditions: Are There Markets That Can Be Stimulated to Promote Population Health?
A tax credit is a tool designed to shift markets and leverage private sector capital. Tax credits will be ineffective when market conditions are insufficient to support investment or are not aligned with the purpose of the credit. For example, the federal cellulosic ethanol credit failed to produce energy at the targeted levels in part because manufacturing capacity was too immature to take advantage of the incentive [12,15]. Job creation credits in state-level enterprise zones have often failed to materialize as intended because the jobs being created did not match the skill sets of residents in the zones [16,17,18].
On the other hand, by spurring demand, the 2006 federal Solar Tax Credit has expanded the market for solar energy. The emerging solar industry required volume sales to reduce production costs so that solar could be offered at a price attractive to consumers. The tax credit provides temporary price reductions (of 30 percent) to achieve that volume. The number of solar installations has increased by 1,600 percent since 2006, the cost of installation has decreased more than 70 percent, and the solar job market has boomed [19]. The solar industry employs over 260,000 people and employment has grown by 123 percent since 2010 [20]. Grid parity or better is expected for solar by 2020 (meaning solar will be cheaper than fossil fuels), suggesting that the market can remain successful beyond the tax credit, which will sunset by 2021 for residential solar and continue at 10 percent beyond 2022 for corporations [21].
Likewise, the LIHTC has been widely lauded for creating a market for affordable housing. Since its inception in 1986, the LIHTC has provided over 3 million affordable housing units. It has become “the single most important form of federal assistance to preserve and expand the supply of affordable rental housing for low-income households” and has done so with bipartisan congressional support [22]. In addition to providing affordable housing, the program has created jobs. According to the National Association of Home Builders, in a typical year, LIHTC development supports approximately 95,700 jobs; $3.5 billion in federal, state, and local taxes; and $9.1 billion in wages and business income [23].
With these examples in mind, the authors of this paper explored two possible markets that could be stimulated to spur investment in population health interventions.
Stimulating Private Sector Demand for Population Health Interventions
Health care insurers and self-insured employers have huge financial interests in population health, because effective population health investments reduce health care costs and improve productivity. For-profit health plans fully insure 62 million Americans (total enrollment includes 122 million Americans). An estimated 100 million Americans are covered by self-funded employer plans [24]. At an average of $10,348 in health care spending per capita, this “market” covers 162 million Americans and totals $1.7 trillion. A modest tax credit of half of 1 percent ($50 per covered life), for example, would yield roughly $80 billion annually (depending on the size of the tax credit, much greater investment might occur) for population health investments. Judging whether this a good investment can be complicated, but this idea can be compared to those already in existence. For example, the primary prevention vehicle currently used by employers is the employee wellness program. These programs are offered by nearly 80 percent of employers, at an average cost of nearly $700 per employee annually, even though the ROI of many such programs is questionable [25].
Even though investments in population health interventions could reduce health care costs and improve productivity, current investment by insurers and self-insured employers is limited (notwithstanding sizable investments in employee wellness programs) for important reasons that could well be addressed by the tools of tax policy:
- One important factor limiting current investment is the length of the return horizon. Corporations of all types are under intense pressure to produce financial results in the short run. Financial returns from investments in population health interventions can take anywhere from a year (e.g., prenatal care for Medicaid mothers), to a few years (e.g., improving adherence to medication for those suffering from hypertension or diabetes), to decades (e.g., preventing tobacco use among children and adolescents).
- A second factor limiting current investment is that private health plans experience considerable enrollment churn (patients enrolled today may not be enrolled tomorrow). In the commercial insurance market, patient turnover has been estimated at about 15 percent per year [26,27]. Churn is exceptionally high in the Medicaid market—as high as 50 percent per year. The instability in their patient bases leaves some insurers reluctant to invest in population health measures because, if patients leave, they fear they will not capture their expected ROI.
- A third factor limiting current investment is the widespread distribution of benefits, often called “the wrong pocket problem.” Many population health interventions create positive returns, but these returns are often spread across numerous sectors and beneficiaries. In the case of lead paint hazard control, for example, benefits far outstrip costs, accruing in the form of health care savings, reduced crime, lower special education costs, higher lifetime earnings, and higher tax revenues [28]. Costs are typically born by a single payer, however, and the subset of benefits that accrue to that payer may not fully compensate those costs.
While these limitations are certainly significant, they could be greatly mitigated by lowering the cost of investing in population health interventions through a tax credit that is large enough and extends over a long enough period to overcome these challenges. In lowering the cost of investing, the risk burden can be dramatically shifted.
Stimulating Investment Capital for Population Health through Charitable Donations
Individuals and businesses that are charitably contributing to their communities provide a potential supply of investment funding for population health. Charitable giving totaled $358 billion in 2014, including $258 billion in donations by individuals and $18 billion by corporations [29]. Since 1968, growth of charitable giving in the United States has been roughly twice that of the S&P 500 [30].
Many states already offer charitable tax credit programs for specific organizations and/or purposes to stimulate donations (see Table 2). The largest of the state programs provided credits for donations that raised $20 million in Arizona for specified anti-poverty organizations, $40 million in Michigan for homeless shelters and food banks, and $24 million per year in Iowa for community foundations [31]. Colorado’s tax credit for donations to child care providers has raised an average $12.6 million in donations in each of the past eight years [32].
Charitable tax credits have the potential to jump-start or expand a donor base for population health interventions. However, like any new or underdeveloped market, the donor base must be cultivated to give over a period of time, in a range of conditions, and in meaningful amounts. Research suggests that charitable giving can be spurred through tax credits, although giving is also sensitive to a variety of factors, such as the health of the economy, the sector being donated to, the income of the giver, whether the donation can be structured as a match, and other features of the state tax code [30].
Price Sensitivity: What is the Optimal Size of the Tax Credit?
Another key consideration in developing any tax credit is its optimal size. The Solar Tax Credit, for example, seems to have successfully matured the market for solar energy with a 30 percent tax credit—that is, consumers receive a rebate equal to 30 percent of the cost of the solar installations. Price sensitivity—the degree to which the price affects consumer or production behaviors—is a function of the underlying markets. Yet, how to arrive at the optimal size of the tax credit bears special attention. If the tax credit is too large, it wastes money by investing more than necessary or by paying for activity that would have occurred anyway. If it is too small, it will fail to stimulate the desired investment.
The charitable tax credit provides a good case in point. If a tax credit were offered to stimulate population health donations, the goal would be to ensure that the amount of giving will increase. A poor outcome would be paying for donations that already occur and/or shifting the donation from one sector to another without increasing the overall level of giving. Survey research suggests that people give for reasons other than the tax break and the importance of the financial benefit is not the primary motive. But the tax subsidy does seem to matter: while the results were mixed, a review of the literature found that charitable giving is sensitive to the size of the incentive, especially among higher-income individuals [33]. Other research has found that charitable donations are influenced significantly by tax incentives [34].
As shown in the summary of selected charitable tax credits (Table 2), the size of the credit (“the price”) varies from 15 percent in Nebraska to 100 percent in Arizona, meaning that Nebraskans could claim $15 of credit for every $100 of giving, and Arizonans could claim the full amount of their donation (subject to caps of $400 per individual). One evaluation study estimated that the Arizona tax credit did little to increase overall giving, while Iowa’s charitable giving credit of 25 percent, with a more generous cap of $300,000, increased donations by 125 percent for both individuals and corporations. Even though Iowa’s tax credit is much smaller than Arizona’s, the generous cap mattered more than the amount of the credit [31].
The federal health insurance Advance Premium Tax Credit (APTC) provides another good example of how price sensitivity can impact effectiveness. Launched in 2014 as part of the Affordable Care Act, the APTC assists individuals and families at 138-400 percent of the federal poverty level (individual income between $16,400 and $47,550, and in non-Medicaid expansion states) in paying for health insurance. The tax credit increased insurance coverage among the lowest income individuals (who received an 80 percent subsidy), but it spurred no significant changes in insurance for those at higher income levels, who received only a 10 percent subsidy [35].

Table 2 | A Summary of Selected Charitable Tax Credits
SOURCE: Teles, D., Do tax credits increase charitable giving? Evidence from Arizona and Iowa, Tulane University Economics Working Paper Series.
Distributional Impacts: Is There a Gap Between Who Claims the Tax Credit and Who Actually Benefits from the Proceeds?
The distributional impacts of tax credits can be analyzed at two levels. First, tax credits create a financial gain for the claimant who claims them. Second, the proceeds from the credit are used to invest in various goods and services, the recipients of whom can vary—sometimes it is the same as the claimant and sometimes not.
Federal tax expenditure (as opposed to tax credit) data show that, with a few notable exceptions, individual claimants tend to skew heavily toward those in upper incomes. Of the 10 largest individual tax expenditures in dollars, 50 percent were claimed by households in the top 20 percent of income, and 17 percent were claimed by households in the top 1 percent income bracket.
There are straightforward reasons for this. First, the “rebate” requires itemization on one’s tax return. Most lower-income households have little financial incentive to itemize. They take the standard deduction because it is typically larger [36]. Second, consumers must have the money up front to pay for the service or good in question, which may not be possible for many lower-income households. Third, the tax break has no value if there is no tax liability, which is often the case for low-income households. Also, for tax deductions and exclusions (unlike credits), the tax break is worth more for higher-income households because they tend to be in higher marginal tax brackets.
There are notable exceptions, however, which are accomplished through the mechanism of “refundablility,” in which the claimant receives the full value of the tax credit even if the claimant’s tax liability is less than the value of the credit. Two very large tax credits are refundable: the APTC and the EITC. For this reason, if one looks at just tax credits rather than the full range of tax expenditures, a very different distribution emerges—one skewed toward the lower range of incomes.
Charitable tax deductions are claimed across the income spectrum. Giving rises with household income, both as a percentage of households that donate as well as the average donation. However, it falls as a percentage of household income donated as income levels rise [37]. In the case of investor tax credits such as the LIHTC, claimants tend to be sophisticated investors, given the complexity of the credit and its function as an asset in financial markets. The majority of LIHTC credits are claimed by corporations in the finance and insurance sector, and by holding companies] [38].
Untangling who actually benefits from the proceeds of a tax credit can be quite complicated. The LIHTC, for example, is intended to benefit low-income households. However, housing projects must generate positive cash flow to entice investors, which has the effect of limiting the LIHTC’s capacity to serve the lowest income households. Additionally, the transferability of the LIHTC has created a secondary market for financiers who may consume 10-27 percent of the total equity investment [38,39]. In the case of enterprise zone programs, the Federal Reserve Bank of San Francisco wrote in its March 2015 Economic Letter: “Our overall view of the evidence is that state enterprise zone programs have generally not been effective at creating jobs. . . . even if there is job creation, it is hard to make the case that [tax advantaged] enterprise zones have furthered distributional goals of reducing poverty in the zones. . . . it is likely that they have generated benefits for the real estate owners who are not the intended beneficiaries” [40].
Tax credits for population health can be designed to help achieve distributional objectives. For example, higher-income communities and more profitable businesses have more taxable income to invest in their own neighborhoods than lower-income communities and smaller or less profitable businesses. This challenge could be addressed by offering a refundable credit and/or allocating tax credits with the explicit intent of ensuring that lower-income communities can also benefit from the credit.
Accountability: How Do Taxpayers Know the Tax Credit is Achieving its Aims?
Accountability may well be one of the biggest criticisms of tax credit programs, but accountability can be, and has been, built into the design of some programs. Once a tax credit is approved, the expenditures take place more or less automatically unless they are set to expire. Many agencies have been drawing attention to tax expenditures and calling for greater accountability [41,42].
There are numerous ways to build accountability into a tax credit program for population health, such as setting very clear population health and ROI goals and limiting the credit to specified evidence-based population health interventions with threshold ROIs. In the case of a charitable tax credit, accountability might be fostered by formally certifying the agencies receiving the charitable donation and/or imposing a small participation fee for state evaluation and monitoring. Various state-level institutional structures, such as special districts (e.g., in California), community health network areas (Massachusetts), and community development finance agencies could possibly perform these accountability functions. Sunset provisions are another mechanism to ensure accountability. Such provisions call for a tax credit to expire after a set number of years, allowing for renewal if successful.
Simplicity: What is Required to Administer the Tax Credit?
The administration of tax credits can be quite simple or highly complex. At one end of the spectrum, the simplest tax credits are nonrefundable demand credits, such as the Solar Tax Credit. Here, taxpayers simply claim the credit on their tax returns. Refundable demand credits, such as the health insurance APTC or the EITC, may be complicated to varying degrees, because eligibility for the credit must be ascertained.
At the other end of the simplicity spectrum are the investor tax credits, which tend to be very complex and typically require experts to assist in navigating the system. For example, there is considerable “leakage,” or inefficient diversion of funds, caused by multiple and complex layers of housing agencies, sponsors, syndicators, lawyers, accountants, and others needed to allocate, create, track, and document the LIHTC [22].
While each state has its own processes for business tax credits, cumbersome certification processes in some states may discourage participation. For example, in New Jersey, the evaluation of the Urban Enterprise Zone stated, “administrative inefficiencies result from complex and bureaucratic processing” and the “cumbersome certification processes increased administrative costs and discourage business participation” [43].
These examples suggest that simpler tax credit designs are not only less costly to administer but also may be more accessible and transparent. However, simplicity must be weighed against other design features that can be layered on a simple structure to improve accountability and equity, as discussed above.
Additional Considerations
The design elements described above are not exhaustive. Other considerations include:
-
- Awareness: Do taxpayers know the credit exists? Many tax credits go unclaimed because payers are unaware of the credit [44,45]. If the taxing entity is willing to offer the incentive, it should include a way of creating broadscale awareness of the benefit. Solar panel manufacturers widely advertised the cost savings associated with the solar credit.
- Predictability and sustainability: What assurances do taxpayers need to invest? In some cases, taxpayers need to count on a continued benefit as they pursue long-term financing arrangements to underwrite their investments. For example, ethanol fuel investors were reluctant to invest in commercial-scale production plants without assurance that the tax credit would remain in place for several years [15]. In population health, the interest is in scaling the production of a variety of interventions over the longer term. Providers of these interventions will be unlikely to build this capacity if there is uncertainty about the level of funding from year to year.
Local control and input: Is there an opportunity for local input regarding how the funds are invested? Population health needs vary from region to region. To maximize the impact of tax credits, local input or administration may be important in determining who makes the decisions about how funds from tax credits are used and what organizations should be trusted to make the most productive use of funds.
Two Illustrative Prototypes for Population Health Tax Credits
Two possible prototypes are explored here in draft form to inspire further thinking and design. The first is a demand credit for self-insured employers, and the second is a charitable tax credit to spur donations to a wellness fund or trust (a funding pool used to support a portfolio of interventions) [46, 47]. Brief summaries of each idea, written as if they were being presented as a summary of a bill to a state legislature, follow.
An Act Establishing a Tax Credit for Self-insured Employers
The purpose of this act is to engage self-insured employers. The act establishes a tax credit for self-insured employers to invest in certified population health interventions for employees and their families for the purposes of improving health, reducing health care costs, and increasing productivity, thereby achieving an ROI. Private sector self-insured employers are eligible to receive a 50 percent credit, capped according to the number of employees. The state Department of Health shall create and maintain a list of certified interventions. These should be evidence-based and have a demonstrated financial ROI for state taxpayers of at least 100 percent within five years of implementation. Each year, the state shall report to the legislature with an evaluation of the tax credit’s effectiveness. Prior to the sunset scheduled for January 1, 2023, the legislature shall review all five annual reports to determine whether this tax credit is serving the residents and employers of the state, recognizing that some positive effects will not be seen in the first five years. The legislature shall determine the continuation of the tax credit no later than October 1, 2022.
An Act Establishing a Charitable Tax Credit to Support Wellness Funds
The purpose of this act is to encourage individuals, businesses, and financial institutions to contribute to local investments in evidence-based population health interventions to improve health outcomes and reduce health inequities. The act establishes a 60 percent tax credit to incentivize charitable donations to regional accountable communities for health (multisector partnerships that form to improve a community’s overall health) that operate 501(c)(3) “wellness funds.” The credit increases each year by three percentage points for up to five years of consecutive giving to mitigate volatility in giving from year to year. Allowable uses of the donated funds are stipulated as follows: no less than 70 percent in certified interventions; up to 12 percent for backbone/integrator organization expenses, capped at $2.5 million; up to 5 percent for marketing the credit to potential donors, capped at $1 million; and 8 percent to revert to the state for reallocation to other areas of the state that may not have equitable conditions for donor activity. The state shall create and maintain a list of certified interventions, which shall be evidence-based and meet certain ROI thresholds as well as other health objectives. Each year, the state shall report to the legislature with an evaluation of the tax credit’s effectiveness. The tax credit sunsets on October 1, 2022, and may be renewed upon a determination that it has met its stated objectives.
Conclusion
The authors of this paper began with the observation that multisector partnerships in regions across the country are doing the hard work of transforming their communities to become vital places where health and well-being are possible for everyone. This is difficult work that requires long-term commitments to changing norms and practices. This shift also requires bold efforts to change the conditions that enable partnerships to prosper. Therefore, it is critical that leaders in the field of population health think creatively and act boldly to develop sources of sustainable financing to support this dramatic shift.
This paper has shown that tax credits, as a policy tool, have the potential to unlock significant resources to support high-impact population health interventions. The authors have examined the important features that may comprise the building blocks of tax credit design. Finally, this paper offers prototypes that illustrate how such population health tax credits might be structured to maximize merit good for the taxpayer, while minimizing potential concerns.
Join the conversation!
![]() Tweet this! Improving population health is critical to a healthy future for all, but sustainable, significant funding is lacking. Our newest #NAMPerspectives explores how tax credits could be leveraged to fund population health: https://doi.org/10.31478/201809g
Tweet this! Improving population health is critical to a healthy future for all, but sustainable, significant funding is lacking. Our newest #NAMPerspectives explores how tax credits could be leveraged to fund population health: https://doi.org/10.31478/201809g
![]() Tweet this! Tax breaks are abundant, but few are aimed at funding population health activities. The authors of our most recent #NAMPerspectives argue that more should be: https://doi.org/10.31478/201809g
Tweet this! Tax breaks are abundant, but few are aimed at funding population health activities. The authors of our most recent #NAMPerspectives argue that more should be: https://doi.org/10.31478/201809g
![]() Tweet this! Altering the course of population health requires long-term commitments from funders to realize change that take time to come to fruition. Tax credits could provide that stability and sustainability: https://doi.org/10.31478/201809g #NAMPerspectives
Tweet this! Altering the course of population health requires long-term commitments from funders to realize change that take time to come to fruition. Tax credits could provide that stability and sustainability: https://doi.org/10.31478/201809g #NAMPerspectives
Download the graphics below and share them on social media!
References
- Dean, H.D., K. M. Williams, and K. A. Fenton. 2013. From theory to action: Applying social determinants of health to public health practice. Public Health Reports 128(Suppl 3):1-4. https://doi.org/10.1177/00333549131286S301
- Woulfe, J., T. R. Oliver, K. Q. Siemering, and S. J. Zahner. 2010. Multisector partnerships in population health improvement. Preventing Chronic Disease 7(6):A119. Available at: https://www.ncbi.nlm.nih.gov/pmc/articles/PMC2995601 (accessed December 3, 2017).
- ReThink Health. 2017. Pulse check on multi-sector partnerships. Available at: https://www.rethinkhealth.org/tools/pulse-check (accessed August 2, 2018).
- Marples, D. J. 2015. Tax expenditures: Overview and analysis. Washington, DC: Congressional Research Service. Available at: http://fedweb.com/wp-content/uploads/2017/01/CRS-Overview-Tax-Expenditures.pdf (accessed August 2, 2018).
- Bartik, T. J. 2017. A new panel database on business incentives for economic development offered by state and local governments in the United States. Kalamazoo, MI: W. E. Upjohn Institute for Employment Research. Available at: http://research.upjohn.org/reports/225 (accessed August 2, 2018).
- GAO (US Government Accountability Office). 2016. Tax expenditures: Opportunities exist to use budgeting and agency performance processes to increase oversight. Washington, DC. Available at: https://www.gao.gov/products/GAO-16-622 (accessed August 2, 2018).
- The Commonwealth Fund. N.d. Spending on health insurance administration per capita. New York. Available at: http://www.commonwealthfund.org/interactives-and-data/chart-cart/chartbook/multinational-comparisons-data-2014/spending-on-health-insurance-administration-per-capita (accessed October 16, 2017).
- Office of the Actuary, National Health Statistics Group. N.d. National health care spending in 2016. Baltimore, MD: Centers for Medicare and Medicaid Services. Available at: https://www.cms.gov/Research-Statistics-Data-and-Systems/Statistics-Trends-and-Reports/NationalHealthExpendData/Downloads/NHE-Presentation-Slides.pdf (accessed August 2, 2018).
- Washington State Institute for Public Policy. 2017. Benefit-cost results. Available at: http://www.wsipp.wa.gov/BenefitCost (accessed July 31, 2018).
- National Conference of State Legislatures. 2010. State balanced budget provisions 2010. Denver, CO. Available at: http://www.ncsl.org/documents/fiscal/StateBalancedBudgetProvisions2010.pdf (accessed August 2, 2018).
- Desilver, D. 2016. The biggest U.S. tax breaks. Pew Research Center Fact Tank, April 6. Available at: http://www.pewresearch.org/fact-tank/2016/04/06/the-biggest-u-s-tax-breaks (accessed August 2, 2018).
- Wicks-Lim, J., and P. S. Arno. 2017. Improving population health by reducing poverty: New York’s Earned Income Tax Credit. Population Health 3(December):373-381. https://doi.org/10.1016/j.ssmph.2017.03.006
- Evans, W. N., and C. L. Garthwaite. 2010. Giving mom a break: The impact of higher EITC payments on maternal health. Cambridge, MA: National Bureau of Economic Research. http://dx.doi.org/10.1257/pol.6.2.258
- Gecan, R. 2010. Using biofuel tax credits to achieve energy and environmental policy goals. Washington, DC: Congressional Budget Office. Available at: https://www.cbo.gov/sites/default/files/111th-congress-2009-2010/reports/07-14-biofuels.pdf (accessed August 2, 2018).
- Doggett, T. Analysis: Cellulosic ethanol industry struggles to take off. Reuters, July 25. Available at: https://www.reuters.com/article/us-usa-ethanol-cellulosic-idUSTRE76O5J920110725 (accessed August 2, 2018).
- Greenbaum, R. T., and J. Landers. 2009. Why are state policy makers still proponents of enterprise zones? What explains their action in the face of a preponderance of the research?” International Regional Science Review 32(4):466-479. https://doi.org/10.1177/0160017609341385
- Peters, A., and P. Fisher. 2002. State enterprise zone programs: Have they worked? Kalamazoo, MI: Upjohn Press. https://doi.org/10.17848/9781417524433
- Office of Policy Analysis. 2013. Evaluation enterprise zone tax credit draft. Annapolis: Maryland Department of Legislative Services. Available at: http://mgaleg.maryland.gov/pubs/budgetfiscal/2013-evaluation-enterprise-zone-tax-credit-draft.pdf (accessed August 2, 2018).
- Solar Energy Industries Association. N.d. Solar investment tax credit. Available at: http://www.seia.org/policy/finance-tax/solar-investment-tax-credit (accessed June 1, 2017).
- The Solar Foundation. 2016. Economic Impacts Report 2016. Available at: https://www.thesolarfoundation.org/solar-jobs-census/economic-impacts-report-2016 (accessed August 2, 2018).
- Nelder, C., and M. Silberg. 2015. Congress extends the Renewable Investment Tax Credit: What now. GreenBiz, December 28. Available at: https://www.greenbiz.com/article/congress-extends-renewable-investment-tax-credit-what-now (accessed December 28, 2017).
- Zigas, B. 2013. Learning from the Low Income Housing Tax Credit: Building a new social investment model. Community Development Investment Review (1):47-55. Available at: http://www.frbsf.org/community-development/files/learning-low-income-housing-tax-credit-building-new-social-investment-model.pdf (accessed August 2, 2018).
- Berger, M. N.d. Low-Income Housing Tax Credit fact sheet. Washington, DC: National Multifamily Housing Council. Available at: http://www.nmhc.org/Advocacy/Low-Income-Housing-Tax-Credit-Fact-Sheet (accessed October 18, 2017).
- Hill, H. 2017. Top five features of a self-funded insurance plan. Healthcare Management Administrators blog. Available at: https://www.accesshma.com/blog/blog/self-funded-insurance/top-five-features-of-a-self-funded-insurance-plan (accessed October 16, 2017).
- Employer wellness programs spend record $693 per worker. 2015. Healthcare Finance News, March 26. Available at: http://www.healthcarefinancenews.com/news/employer-wellness-programs-spend-record-693-worker (accessed August 2, 2018).
- Partners, F. 2016. Finn Partners national survey reveals how fragmented health system places greater burden on patients. Cision PR Newswire, February 9. Available at: https://www.prnewswire.com/news-releases/finn-partners-national-survey-reveals-how-fragmented-health-system-places-greater-burden-on-patients-300217167.html (accessed October 16, 2017).
- D. Power. 2015. 2015 member health plan study. Available at: http://www.jdpower.com/press-releases/2015-member-health-plan-study (accessed August 2, 2018).
- Gould, E. 2009. Childhood lead poisoning: Conservative estimates of the social and economic benefits of lead hazard control. Environmental Health Perspectives 117(7):1162-1167. https://doi.org/10.1289/ehp.0800408
- Radde, T. 2015. Giving USA: Americans donated an estimated $358.38 billion to charity in 2014; highest total in report’s 60-year history. Philanthropy, June 29. Available at: https://givingusa.org/giving-usa-2015-press-release-giving-usa-americans-donated-an-estimated-358-38-billion-to-charity-in-2014-highest-total-in-reports-60-year-history (accessed September 1, 2018).
- List, J. A. 2011. The market for charitable giving. Journal of Economic Perspectives 25(2):157-180. Available at: http://home.uchicago.edu/~jlist/papers/The%20Market%20for%20Charitable%20Giving.pdf (accessed August 2, 2018).
- Teles, D. 2016. Do tax credits increase charitable giving? Evidence from Arizona and Iowa. New Orleans, LA: Tulane Economics Working Paper Series. Available at: http://econ.tulane.edu/RePEc/pdf/tul1606.pdf (accessed August 2, 2018).
- Executives Partnering to Invest In Children. N.d. Colorado’s child care contribution tax credit. Available at: http://www.coloradoepic.org/cctc (accessed August 2, 2018).
- Duquette, N. J. 2014. Do tax incentives affect charitable contributions? Evidence from public charities’ reported revenues. Los Angeles, CA: University of Southern California Sol Price School of Public Policy. Available at: https://bedrosian.usc.edu/files/2015/05/Duquette-Do-Tax-Incentives-Affect-Charitable-Contributions-Evidence-from-Public-Charities-Reported-Revenues.pdf (accessed August 2, 2018).
- Bakija, J., and B. T. Heim. 2011. How does charitable giving respond to incentives and income? New estimates from panel data. National Tax Journal64(2):615-650. Available at: https://www.ntanet.org/NTJ/64/2/ntj-v64n02p615-50-how-does-charitable-giving.pdf?v=%CE%B1&r=19426893815398216 (accessed September 2, 2020).
- Hinde, J. M. 2016. Incentive(less)? The effectiveness of tax credits and cost-sharing subsidies in the Affordable Care Act, SSRN Scholarly Paper ID 2760130. Rochester, NY: Social Science Research Network. Available at: https://papers.ssrn.com/abstract=2760130 (accessed August 2, 2018).
- Lu, C. 2017. Itemized deductions tax debate 2017. Washington, DC: Urban Institute. Available at: https://www.urban.org/research/publication/itemized-deductions-0 (accessed August 2, 2018).
- Blackman, A. 2015. The surprising relationship between taxes and charitable giving. The Wall Street Journal, December 12, Wealth Management. Available at: https://www.wsj.com/articles/the-surprising-relationship-between-taxes-and-charitable-giving-1450062191 (accessed August 2, 2018).
- Desai, M., D. Dharmapala, and M. Singhal. 2008. Investable tax credits: The case for the Low Income Housing Tax Credit. Cambridge, MA: Harvard Kennedy School Faculty Research Working Paper Series. Available at: https://research.hks.harvard.edu/publications/getFile.aspx?Id=429 (accessed June 24, 2017).
- Government Accountability Office. 1997. Tax credits: Opportunities to improve oversight of the Low-Income Housing Program, no. GGD/RCED-97-55. Washington, DC. Available at: https://www.gao.gov/products/GGD/RCED-97-55 (accessed August 2, 2018).
- Neumark, D., and H. Simpson. 2015. Do place-based policies matter? Federal Reserve Bank of San Francisco. Available at: http://www.frbsf.org/economic-research/publications/economic-letter/2015/march/enterprise-zone-economic-incentive-tax-subsidy-place-based-policies (accessed August 2, 2018).
- Government Accountability Office. 2012. Tax expenditures: Background and evaluation criteria and questions. Washington, DC. Available at: http://www.gao.gov/assets/660/650371.pdf (accessed August 2, 2018).
- How states are improving tax incentives for jobs and growth. 2017. Philadelphia, PA: The Pew Charitable Trusts. Available at: http://www.pewtrusts.org/~/media/assets/2017/05/edti_how_states_are_improving_tax_incentives_for_jobs_and_growth.pdf?la=en (accessed August 2, 2018).
- New Jersey enterprise zone program assessment. Mechanicsburg, PA: Delta Development Group; New York: HR&A Advisors. Available at: http://www.nj.gov/dca/affiliates/uez/publications/pdf/NJ%20
Urban%20Enterprise%20Zone%20Program.pdf (accessed July 19, 2017). - Shams, S. 2015. State urges working poor to claim tax credits. KCRA, December 8. Available at: http://www.kcra.com/article/state-urges-working-poor-to-claim-tax-credits/6426175 (accessed August 2, 2018).
- Oregon Center for Public Policy. 2017. Oregon’s low EITC participation leaves over $100 million unclaimed. Available at: https://www.ocpp.org/2017/01/24/fs20170124-oregon-eitc-participation-use-rate (accessed August 2, 2018).
- Becker, S. 2017. Establishing a charitable state tax credit to finance regional wellness funds. ReThink Health blog, December 20. Available at: https://www.rethinkhealth.org/the-rethinkers-blog/establishing-a-charitable-state-tax-credit-to-finance-regional-wellness-funds (accessed August 2, 2018).
- Burke, N. 2018. Incenting the private sector to invest in population health: A tax credit for self-insured employers. ReThink Health blog, January 16. Available at: https://www.rethinkhealth.org/the-rethinkers-blog/incenting-the-private-sector-to-invest-in-population-health-a-tax-credit-for-self-insured-employers (accessed August 2, 2018).