Observations from the Field: Reporting Quality Metrics in Health Care
Measurement is a critical tool for monitoring progress and driving improvement in health care. However, without meaningful coordination and management—particularly when public reporting is required—the effectiveness of measurement activities is limited and the diversion of effort from other activities can be detrimental to an organization. Often, the metrics used in quality reporting are derived from billing and administrative systems. Concentrating on improving these metrics may siphon energy from more meaningful or clinically relevant improvements. Too many measures can blur the focus on an institution’s priority issues while crowding out resources in terms of time, staffing, and money needed for innovation and improvement. Overall costs are increased. Also, metrics may be influenced by socioeconomic factors that are inadequately measured, thereby disproportionately penalizing providers (both hospitals and clinicians) that care for low-income patients.
Hospitals and provider groups are increasingly being asked to report on process and outcome metrics in attempts to signify the quality of the care provided to patients and to provide transparency to the public. Advocates of public reporting believe it helps patients choose the best place for their care. Additionally, transparency of quality metrics within a health care organization may guide improvement efforts and lead to positive behavior changes of health care personnel. While there is no doubt that metric reporting has focused positive attention on the quality of health care, the costs and benefits associated with these activities are poorly understood.
Approach
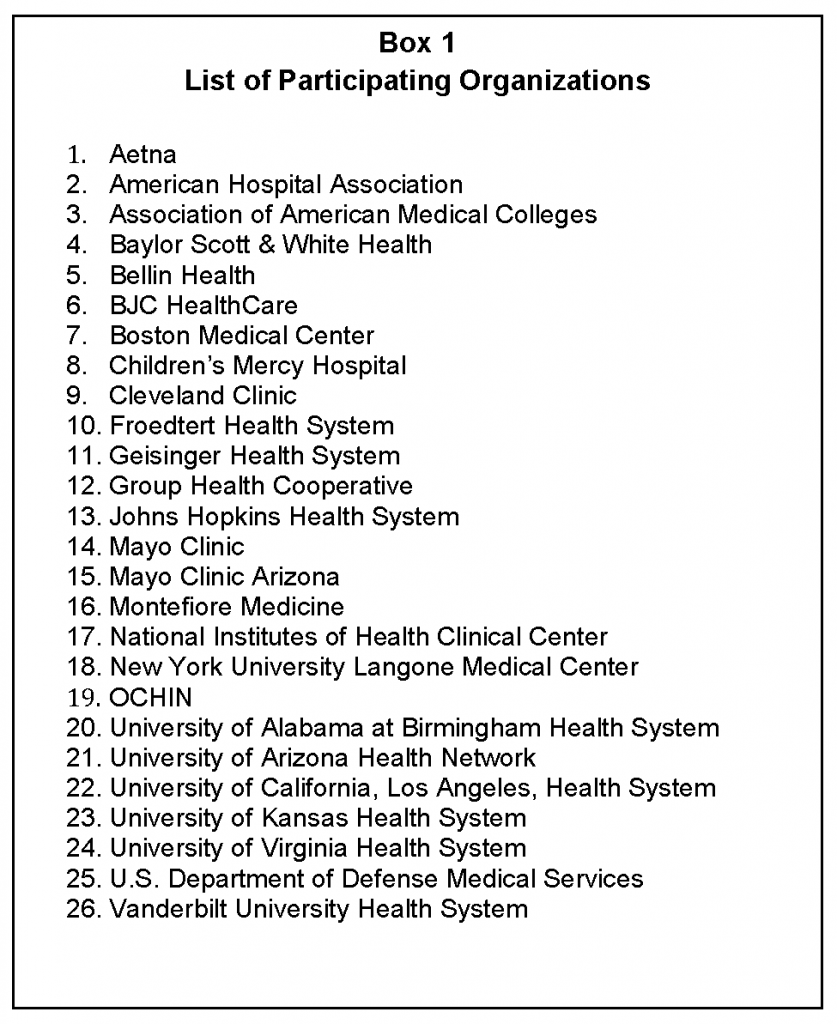
This discussion paper presents perspectives and insights of several health care organization executives on the burden and benefit of quality metric reporting. Executives from 21 health systems ranging in size from 180 to more than 4,000 beds; 2 ambulatory provider groups; 2 health care associations representing hundreds of members; and 1 insurer participated. A list of these organizations is included in Box 1. The primary author used qualitative methodology involving collecting interview data from the participants and using what was said to generate potential inquiries for further exploration (Auerbach et al., 2003; Wisker, 2010). Open and closed questions were provided to the executives in advance of telephone interviews. The primary author compiled, summarized, and presented participant responses as themes or questions. A subset of participants (all authors on this discussion paper other than the primary author) debated, refined, and finalized the points and recommendations presented.
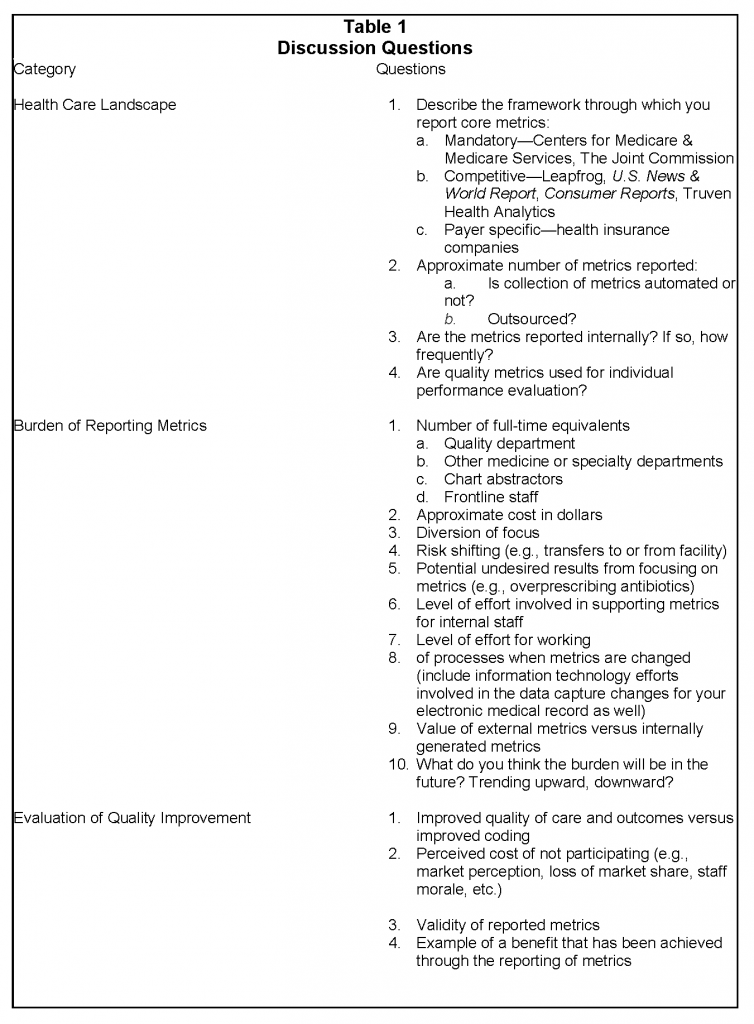
This sample is not intended to be either random or representative; however, it includes a diverse range of perspectives and institutional characteristics to guide the discussion on the benefits and burdens of metric reporting. Each of the participants was provided with a standard list of questions in three areas: (1) local health care landscape, (2) burden of reporting metrics, and (3) evaluation of quality improvement. The complete list of questions is provided in Table 1. The findings presented below represent perspectives that emerged during these discussions. Respondents estimated the number of personnel involved and the costs associated with maintaining the infrastructure needed to report metrics.
System Perspectives on Measurement Challenges
All of the health systems reported metrics that are mandated by federal and state governments, accreditation agencies, and commercial payment organizations. As background, the Centers for Medicare & Medicaid Services has approximately 1,700 measures for providers within different practice settings, many tied to payment for services (CMS, 2016). Most health insurance plans are scored on more than 80 Healthcare Effectiveness Data and Information Set (HEDIS) measures that are vetted through the National Committee for Quality Assurance (NCQA, 2016). The Joint Commission uses another 57 measures to gauge the quality of inpatient care for hospitals (The Joint Commission, 2016). A detailed overview of major reporting requirements is presented in the 2015 Institute of Medicine report Vital Signs: Core Metrics for Health and Health Care Progress (IOM, 2015).
Respondents from this survey estimated that mandatory metric reporting (mandated for accreditation or payment) for their institutions ranged in number from 284 to more than 500. There was less participation by the health systems in metrics considered optional, such as those derived by commercial groups (e.g., Leapfrog). Participation in metric reporting for commercial groups is largely dependent on the competitiveness of the geographic market where the health system resides. Commercial payers are increasingly requiring providers to report metrics, and some respondents estimated more than 400 metrics per year are reported to these payers and that many of these metrics change at least annually. In addition to metric reporting for outside entities, all of the health systems interviewed participated in collecting metrics for internal process improvement efforts.
Physician groups are also asked to report quality metrics. Fewer metrics are reported in the ambulatory setting, but the administrative effort for physicians in this setting is significant. The 2 ambulatory provider groups estimated between 50 and 100 metrics are reported annually. These measures tend to be process measures that rely on the documentation of tests or preventive services delivered.
There will likely be a substantial increase of new metrics over the next few years as payers continue to accelerate their portfolio of risk-based contracting, value-based purchasing, and alternative payment models. Another area where reporting quality metrics is expanding is in the reporting to specialty or disease registries. These metrics are primarily driven by the physician specialty societies and are aimed at determining best practices, cost effectiveness, outcomes of different treatments, and variations in practice. Registries (with their associated costs) will proliferate as interest in post-surveillance of medical devices or pharmaceuticals and comparative research increases.
Process for Metric Collection
The collection of data for metric reporting is not simple. Although all of the providers used electronic health records (EHRs), the large majority of health systems and physician groups responded that only a portion of the quality metric reporting is automated.
Documentation by the physician is crucial for accurate attribution and capture of information needed for risk adjustment. Often physicians must re-examine their record to clarify terms and ensure that all relevant wording is used to describe the care delivered. Because this re-examination of documentation may not occur and is not standardized, a comparison of data across physician groups or institutions may be misleading.
A significant effort is required to understand the specifics of what a given metric is trying to measure. Slight variations in the definitions posed by different groups result in an effort to reanalyze the diagnosis, condition, or outcome being evaluated (numerator) and the population under consideration (denominator). The populations defined for measurement may differ by insurance carrier, severity of disease, or age. Each change in definition requires a chain of assumptions as the request is analyzed, data sources are identified, documentation is clarified, data are validated, and metrics are submitted. Standardizing the documentation input into EHRs can be helpful, but with changes in metric definitions, the data fields within the EHR must be changed and providers must be trained to document differently.
Increasingly, metrics collected for quality improvement purposes are included in reimbursement methodologies for hospitals and clinicians in pay-for-performance frameworks. Many institutions have invested heavily to optimally collect these data to report. Health systems and physician groups with lower margins have fewer resources for this purpose and may be inadvertently penalized through lower reimbursement.
Personnel Required for Metric Collection and Reporting
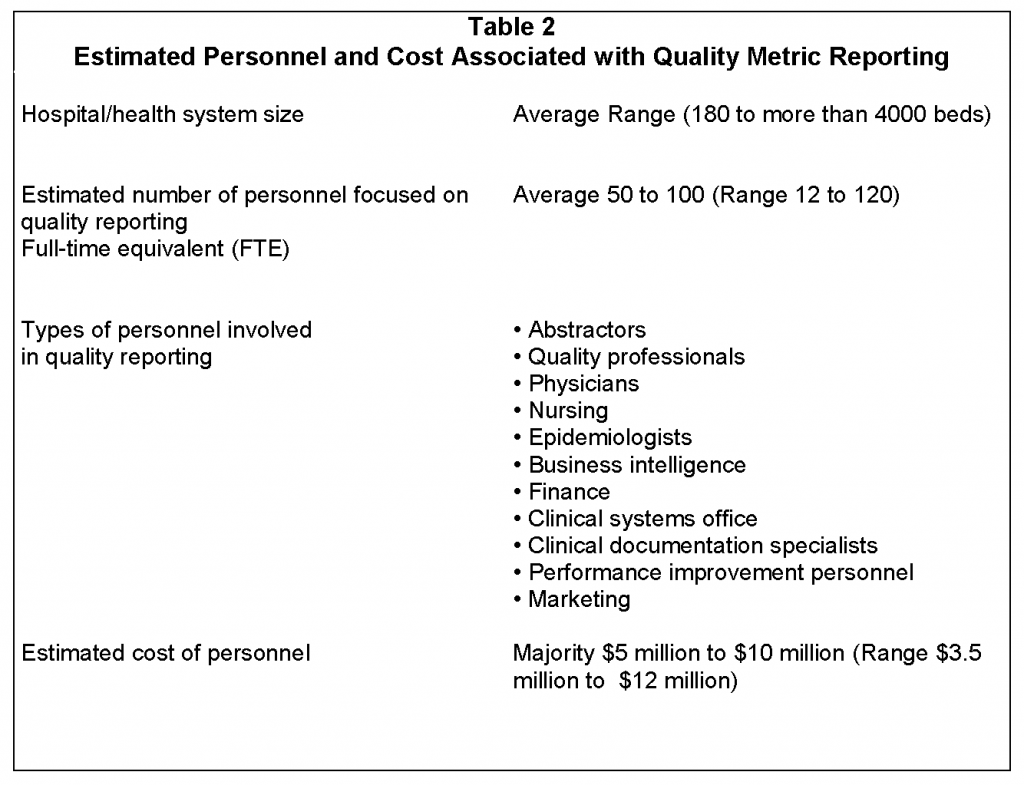
Quality metric reporting involves numerous people across health systems. Departments cited as participating include Business Intelligence, Health Information Technology, Clinical Systems Office, Quality Departments, Nursing, and Clinical Departments (see Table 2). Because a coordinated effort is needed to consistently analyze and report metrics, an infrastructure is required to efficiently manage the processes. Health systems reported on average 50 to 100 individuals (collective full-time equivalents) involved in this process (range 12 to 120). The number of individuals varied somewhat by the size of the organization and the integration of continuous process improvement into the workflow of the organization. The range in cost of personnel was estimated to be from $3.5 to $12 million with most health systems reporting $5 to $10 million. Additionally, institutions may spend substantial sums to recruit and train these individuals.
The same infrastructure is generally used to report metrics for internal process improvement efforts and external reporting. Once external metrics are reported by a health care provider and are present in the public domain, organizations such as U.S. News & World Report, Consumer Reports, and Truven Health Analytics can leverage these data and present data subsets for comparisons. This puts no additional burden on the providers for reporting, but providers often have difficulty ensuring that their organizations are represented accurately because the quality algorithms used may be proprietary. Many health care providers use other third-party groups such as Press Ganey and MIDAS™ (Medical Identity Alert System) to report quality metrics for some of the mandatory programs. Outsourcing this reporting function decreases the burden on health system personnel.
Ambulatory provider groups also need an infrastructure to analyze and report metrics. Private physician practices are consolidating for the purposes of managing EHRs and metric reporting. The cooperatives are more efficient than individual practices, requiring approximately 25 to 55 individuals for approximately 1,000 to 2,000 physicians.
Although all 26 participants responded that the reporting of metrics was important for focusing efforts on improved patient care, 70 percent felt that the number of metrics being requested is overwhelming. Much effort is being directed to collecting and reporting metrics. Depending on the financial health of the organization, there may be a diversion of focus from process improvement and patient care to metric reporting. Often, a health system’s goals for internal improvement must be delayed because there are insufficient resources to improve results for both internal and external quality metrics. Because reimbursement is often linked to external metrics, these take priority.
Documentation is a major contributor to accurate metric reporting. If the documentation does not reflect the nuances in the care delivered, the quality metric derived from the documentation may be misleading. Many respondents reported that much of the initial improvement in the performance measured by quality metrics is not actually improvement in patient care, but improvement in documentation. After documentation is “cleaned up” so that it accurately reflects the care being provided, improvement efforts in care processes will be reflected in the metric result.
Challenges and Next Steps Toward Better Measurement
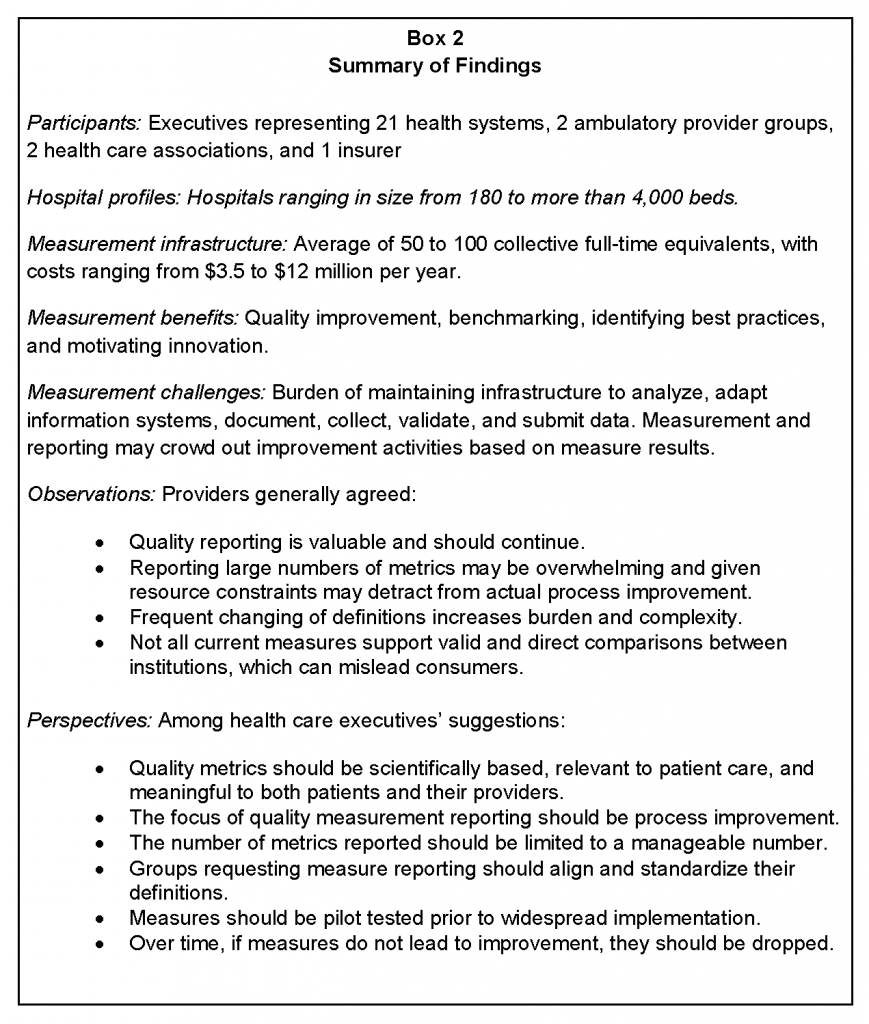
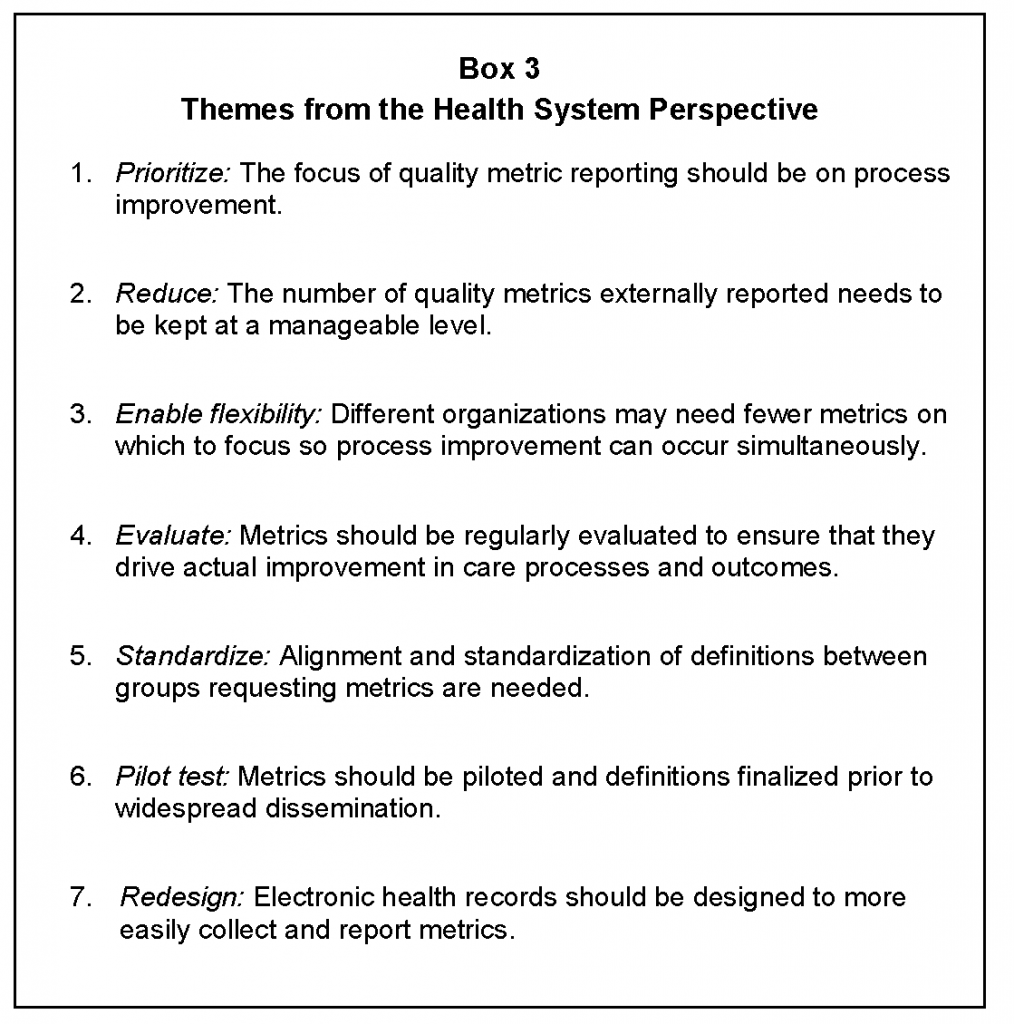
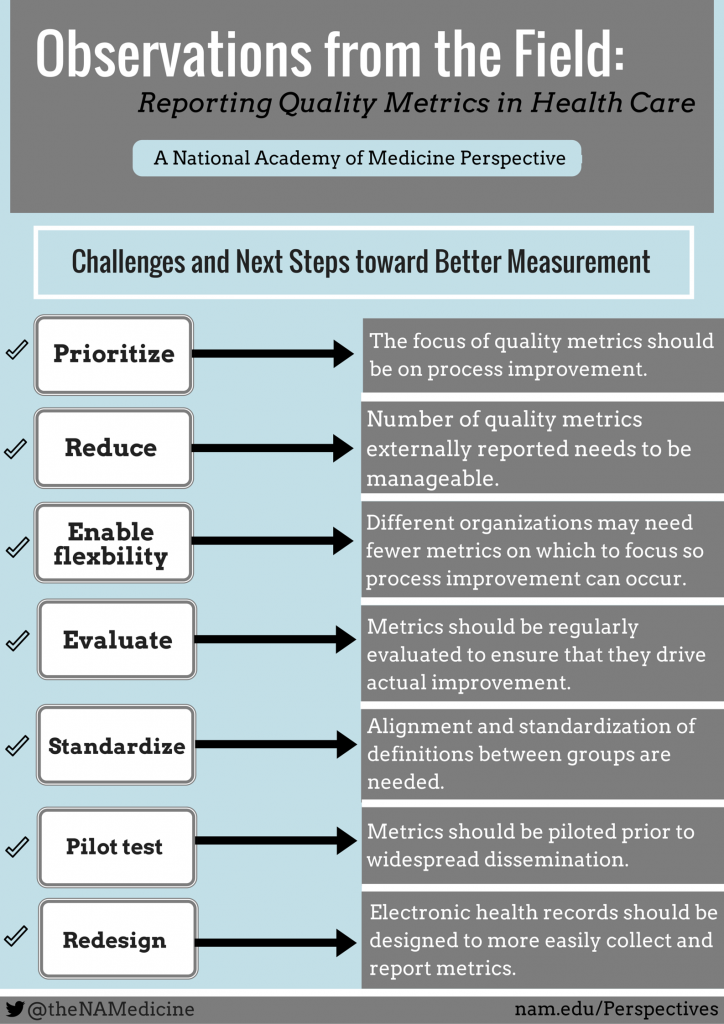
There is no doubt that the reporting of quality metrics has changed the dialogue among health care providers and focused their efforts on improving patient care. Metric reporting has spurred process improvement efforts and many institutions gain pride in building a reputation of quality. Every provider interviewed believes that it is important to continue quality reporting. Standard metric reporting allows providers to benchmark their results and learn best practices from those who are more successful. However, there is uniform agreement that reporting large numbers of metrics may be overwhelming and may detract, because of resource constraints, from actual process improvement. Several themes emerged from the discussions with providers and are outlined below and are summarized in Box 2.
Theme #1: The focus of quality metric reporting should be on process improvement.
For providers, the purpose of metric reporting is to prompt improvement in patient care. However, as the number of metrics increase, more resources are being consumed for reporting metrics and fewer resources are being focused on continuous process improvement. The time delay in the reporting of metrics (sometimes up to 2 years) creates confusion in intent. If the purpose of collecting, reporting, and benchmarking is to improve care and change provider behavior, the time delay severely limits the utility of performance feedback in supporting rapid improvement and provider behavior change.
Theme #2: The number of quality metrics externally reported need to be kept at a manageable level.
Physicians often report feeling overwhelmed learning how to use EHRs, documenting information important for quality metrics and meaningful use, and changing their way of coding using ICD-10 (the 10th revision of the International Classification of Diseases and Related Health Problems). This is at a time when clinician pay is largely being based on productivity and the number of patients seen. There is a tension between seeing more patients and thoroughly documenting the care for the purpose of quality reporting, particularly when specific metrics have not been shown to improve patient outcomes. Requirements for documenting hierarchical condition categories for risk scoring only amplifies this tension.
Systems that have adequate resources are working to keep physicians away from the technical aspects of collecting and reporting metrics. This requires additional personnel to review documentation and ensure that optimal information is provided in the chart so that metrics can be correctly reported.
Theme #3: Different organizations may need fewer metrics on which to focus so process improvement can occur simultaneously.
A relatively large infrastructure is needed to be able to collect, correct, analyze, and report quality metrics. Organizations that cannot invest in the personnel and systems required are at a disadvantage compared to organizations that can make the investment.
Budget neutral, pay-for-performance programs can create a dilemma for inner city, safety net, and rural/critical access hospitals. These organizations tend to have small revenue margins due to the payer mix of patients. With the resulting inability to invest in needed resources, focus is often on optimizing documentation and the reporting of metrics instead of internal process improvement. When these organizations compete with others with healthier revenue margins that can simultaneously invest in process improvement, the payments to the revenue strapped institutions decrease as true improvements lag. Payment penalties are also more likely to fall on these resource poor institutions. Over time, payments are redistributed to institutions that have a better ability to perform well on quality metrics.
Annual quality programs establish goals based on the performance risk of providers. Historically, internal groups have worked to eliminate the risk of harm and improve quality based on internal reviews. As metrics are proliferating, particularly ones with payment implications, the limited internal resources are being shifted to work on improving metric scores and not on the internally identified opportunities. If the metrics are not relevant to the particular health care facility, this diversion of focus inhibits improvement in quality patient care.
Theme #4: Metrics should be regularly evaluated to ensure that they drive actual improvement in care outcomes.
The providers surveyed do not consider all reported metrics to reveal what the measurement is intended to show. Also, direct comparisons between institutions or providers may be misleading. The raw data (e.g., mortality, length of stay, hospital-acquired conditions, etc.) from different entities may have different weights and statistical methodologies applied depending on the evaluator, thereby leading to inconsistencies in the ratings of institutions. This creates confusion for patients trying to use ratings to guide them in choosing the best care.
Variations within the services provided at health systems and the populations of patients served lead to differences in results. Respondents from health systems that receive a large number of complex patients remarked that the current risk adjustment methodologies do not adequately take into account the differences of this patient population. Socioeconomic factors significantly impact quality scores for institutions that care for low-income patients. No one believes that there should be a different standard of care for patients of lower socioeconomic status. However, factors associated with lower socioeconomic status—homelessness, poor social support, poor nutritional support, smoking, obesity, etc.—make caring for these patients in an ambulatory setting more difficult and result in higher readmission rates. Physician practices and hospitals in low-income and rural areas are vulnerable to the negative impact of reimbursement for quality programs. If they are damaged, the health care safety net will be further compromised.
In some areas, real improvements in quality have been achieved through a collective focus on a selected set of quality metrics. In these instances, results have clearly demonstrated that metric reporting has made a positive difference in patient care. Some institutions have developed internal incentive programs that are linked to achieving quality goals. Successful incentive programs have shaped healthy organizational cultures focused on quality. These internal metrics linked to compensation have shaped behavior more than externally linked quality benchmarks.
However, some report that in a substantial number of cases, quality efforts have focused primarily on documentation and changes in coding without real clinical benefit. This is particularly true when metrics are derived from claims data that poorly represent the processes of actual care delivered. There is an intrinsic conflict between the use of data to code for billing versus quality assessment. The clinical classification system used for coding was not designed to collect quality or patient safety outcomes, so it may not capture all the nuances of each individual case. In some instances, institutions are foregoing a higher level of reimbursement because the proper coding may imply other conditions that worsen reported quality metrics.
Payment incentives have increased the targeted effort of institutions for improving the score on these metrics. Internal areas of needed focus such as organizational culture or process of care issues may be passed over due to the need to minimize the impact of penalties if target scores are not reached. Many physicians have become cynical that the institutional objective is primarily a monetary one. This sense of cynicism is increased when physicians do not believe that the metrics have a scientific basis and that providers are being held accountable for patient behaviors over which they have no control. The use of administrative data as a performance tool tends to place disproportionate focus on documentation, coding, and validation rather than clinical quality improvement. Also, the attachment of payment to the metric score has forced providers to pay more attention to these metric results, often at the expense of what they consider more important improvement initiatives. Physician reimbursement is often linked to the reporting of metrics, but clinicians in private practices have difficulty supporting the personnel needed to accurately report on the care provided. This is one reason given by respondents as to why physicians are leaving private practice and becoming employees of hospitals and health systems.
The governance structures of the health systems did not appear to have an impact on whether there was alignment around quality. However, many respondents commented that metric reporting could be divisive when alignment is not strong. Hospital administrators may become frustrated when hospital reimbursement is pegged to unengaged physicians’ actions. An integrated organizational structure is less important than a shared organizational culture. Leadership is vital to drive the culture and demonstrate that the metrics map to the institution’s priorities.
Theme #5: Alignment and standardization of definitions among groups requesting metrics are needed.
Slight variations in the definitions of metrics that are designed to measure essentially the same thing create significant work for the reporting organization. If mandatory programs, commercial reporting organizations, and payers use clear and consistent definitions for metrics, then a significant burden for health care providers will be removed. Ideally, the metrics chosen would be available in a timely manner and be relevant to care improvement processes. Harmonization of measures should lead to a decreased burden on providers to report and to the realization of quality improvement opportunities that matter most to patients.
Theme #6: Metrics should be piloted and definitions finalized prior to widespread dissemination.
Metrics should be comparable across institutions, drive quality within the institutions, and be meaningful to both providers and patients. Individuals knowledgeable in patient care who do not have a vested interest in particular metrics should select what is measured. A clear process to define and standardize both the numerator and the denominator should be followed. Because changes to metrics create a substantial administrative burden on providers, metrics should be tested to ensure that definitions are finalized and the metrics measure what is intended. Over time, if metrics do not lead to improvement, then they are not meaningful or relevant to the individuals that can drive change; therefore, an evaluation of the success of metrics to drive improvement must be part of the process for maintaining and adjusting metrics over time.
Theme #7: Electronic health records should be designed to more easily collect and report metrics and we should move away from quality metrics derived from billing and administrative systems.
Information technology (IT) systems have the potential to decrease the burden of quality metric reporting. Simplifying and standardizing the documentation of care will minimize the number of individuals needed to collect and report metrics. These “e-measures” have the potential to allow the collection of metrics without manual abstraction. However, the more automated the system, the more cumbersome it is to change when metric definitions change or new metrics are added. When programming an IT system, one must understand the “upstream” and “downstream” effects of the change because the data input feeds multiple applications. Improved integration of EHRs with clinically-driven registries (e.g., NSQIP) will also improve the rapid evaluation of the clinical effectiveness of new treatments.
Summary
Box 3 summarizes the themes derived from the respondents’ comments. Of note, a question that many of the respondents asked was, “How much ‘quality’ is enough?” Every provider agrees that meaningful and scientifically based metrics are valuable to focus efforts to improve care. However, once improvement is achieved, there is some question as to how many resources should be devoted to a single metric in efforts to achieve perfection. When payment is attached to an ever-increasing score, providers are being directed to prioritize efforts on the metrics determined by federal, state, or commercial payers instead of focusing on what the institutions believe to be higher priorities. Focus on outliers that fail measurement specifications for the sole purpose of improving a score does not represent real quality improvement.
Another concern was that the public is not well informed about the meaning behind quality metrics. Many respondents commented that people become confused when multiple benchmarking services assign different ratings for the same hospital. Additionally, marketing of a single highly ranked metric may mislead the public in believing that all care is exceptional.
In summary, all institutions surveyed believe that they have benefited from and must continue to participate in quality metric reporting. However, many believe that there is poor correlation between what we measure and what we want the measurement to reveal. We are in the infancy of quality reporting in health care and as a result of the desire to move quickly to value-based payments we may be spending resources on chasing metrics that are not improving care. As we learn how to measure quality, further analysis, refinement, and simplification of metric reporting should occur to minimize the burden on health care providers and improve the outcomes of care that truly matter to patients.
Download the graphic below and share it on social media!
References
- Auerbach, C., and L. B. Silverstein. 2003. Qualitative data: An introduction to coding and analysis. New York: New York University Press. P. 8.
- CMS (Centers for Medicare & Medicaid Services). 2016. Quality measures. Available at: https://www.cms.gov/Medicare/Quality-Initiatives-Patient-Assessment-Instruments/QualityMeasures (accessed July 28, 2020).
- Institute of Medicine. 2015. Vital Signs: Core Metrics for Health and Health Care Progress. Washington, DC: The National Academies Press. https://doi.org/10.17226/19402
- The Joint Commission. 2016. Core measure sets. Available at: http://www.jointcommission.org/core_measure_sets.aspx (accessed July 28, 2020).
- NCQA (National Committee for Quality Assurance). 2016. HEDIS® measures. Available at: http://www.ncqa.org/HEDISQualityMeasurement/HEDISMeasures.aspx (accessed July 28, 2020).
- Wisker, G. 2010. The postgraduate research handbook: Succeed with your MA, MPhil, EdD and PhD, 2nd Edition. New York: Palgrave Macmillan.

